Pedestrian Dynamics 4.4 Now Available
Pedestrian Dynamics® 4.4 Now Available! As a global software company delivering Digital Twin Software, InControl Enterprise Dynamics is dedicated to advancing software development to meet
Portfolio
Optimize your business by improving efficiency, predictability, and compliance.
> Free Trial Software
Download the software and get started!
Domains
Discover the application areas of our Digital Twin Software
Education
Universities, Applied Sciences, R&D Institutes
> Download Student Software
Download the software and get started!
> Teacher Materials
Visit our Teacher platform SimuTeach
Resources
Licensed software, free trials and student software
> Software Downloads
Download the software and get started!
Company
Learn more about InControl Enterprise Dynamics
Open vacancies
> Software Developer
> Account Manager
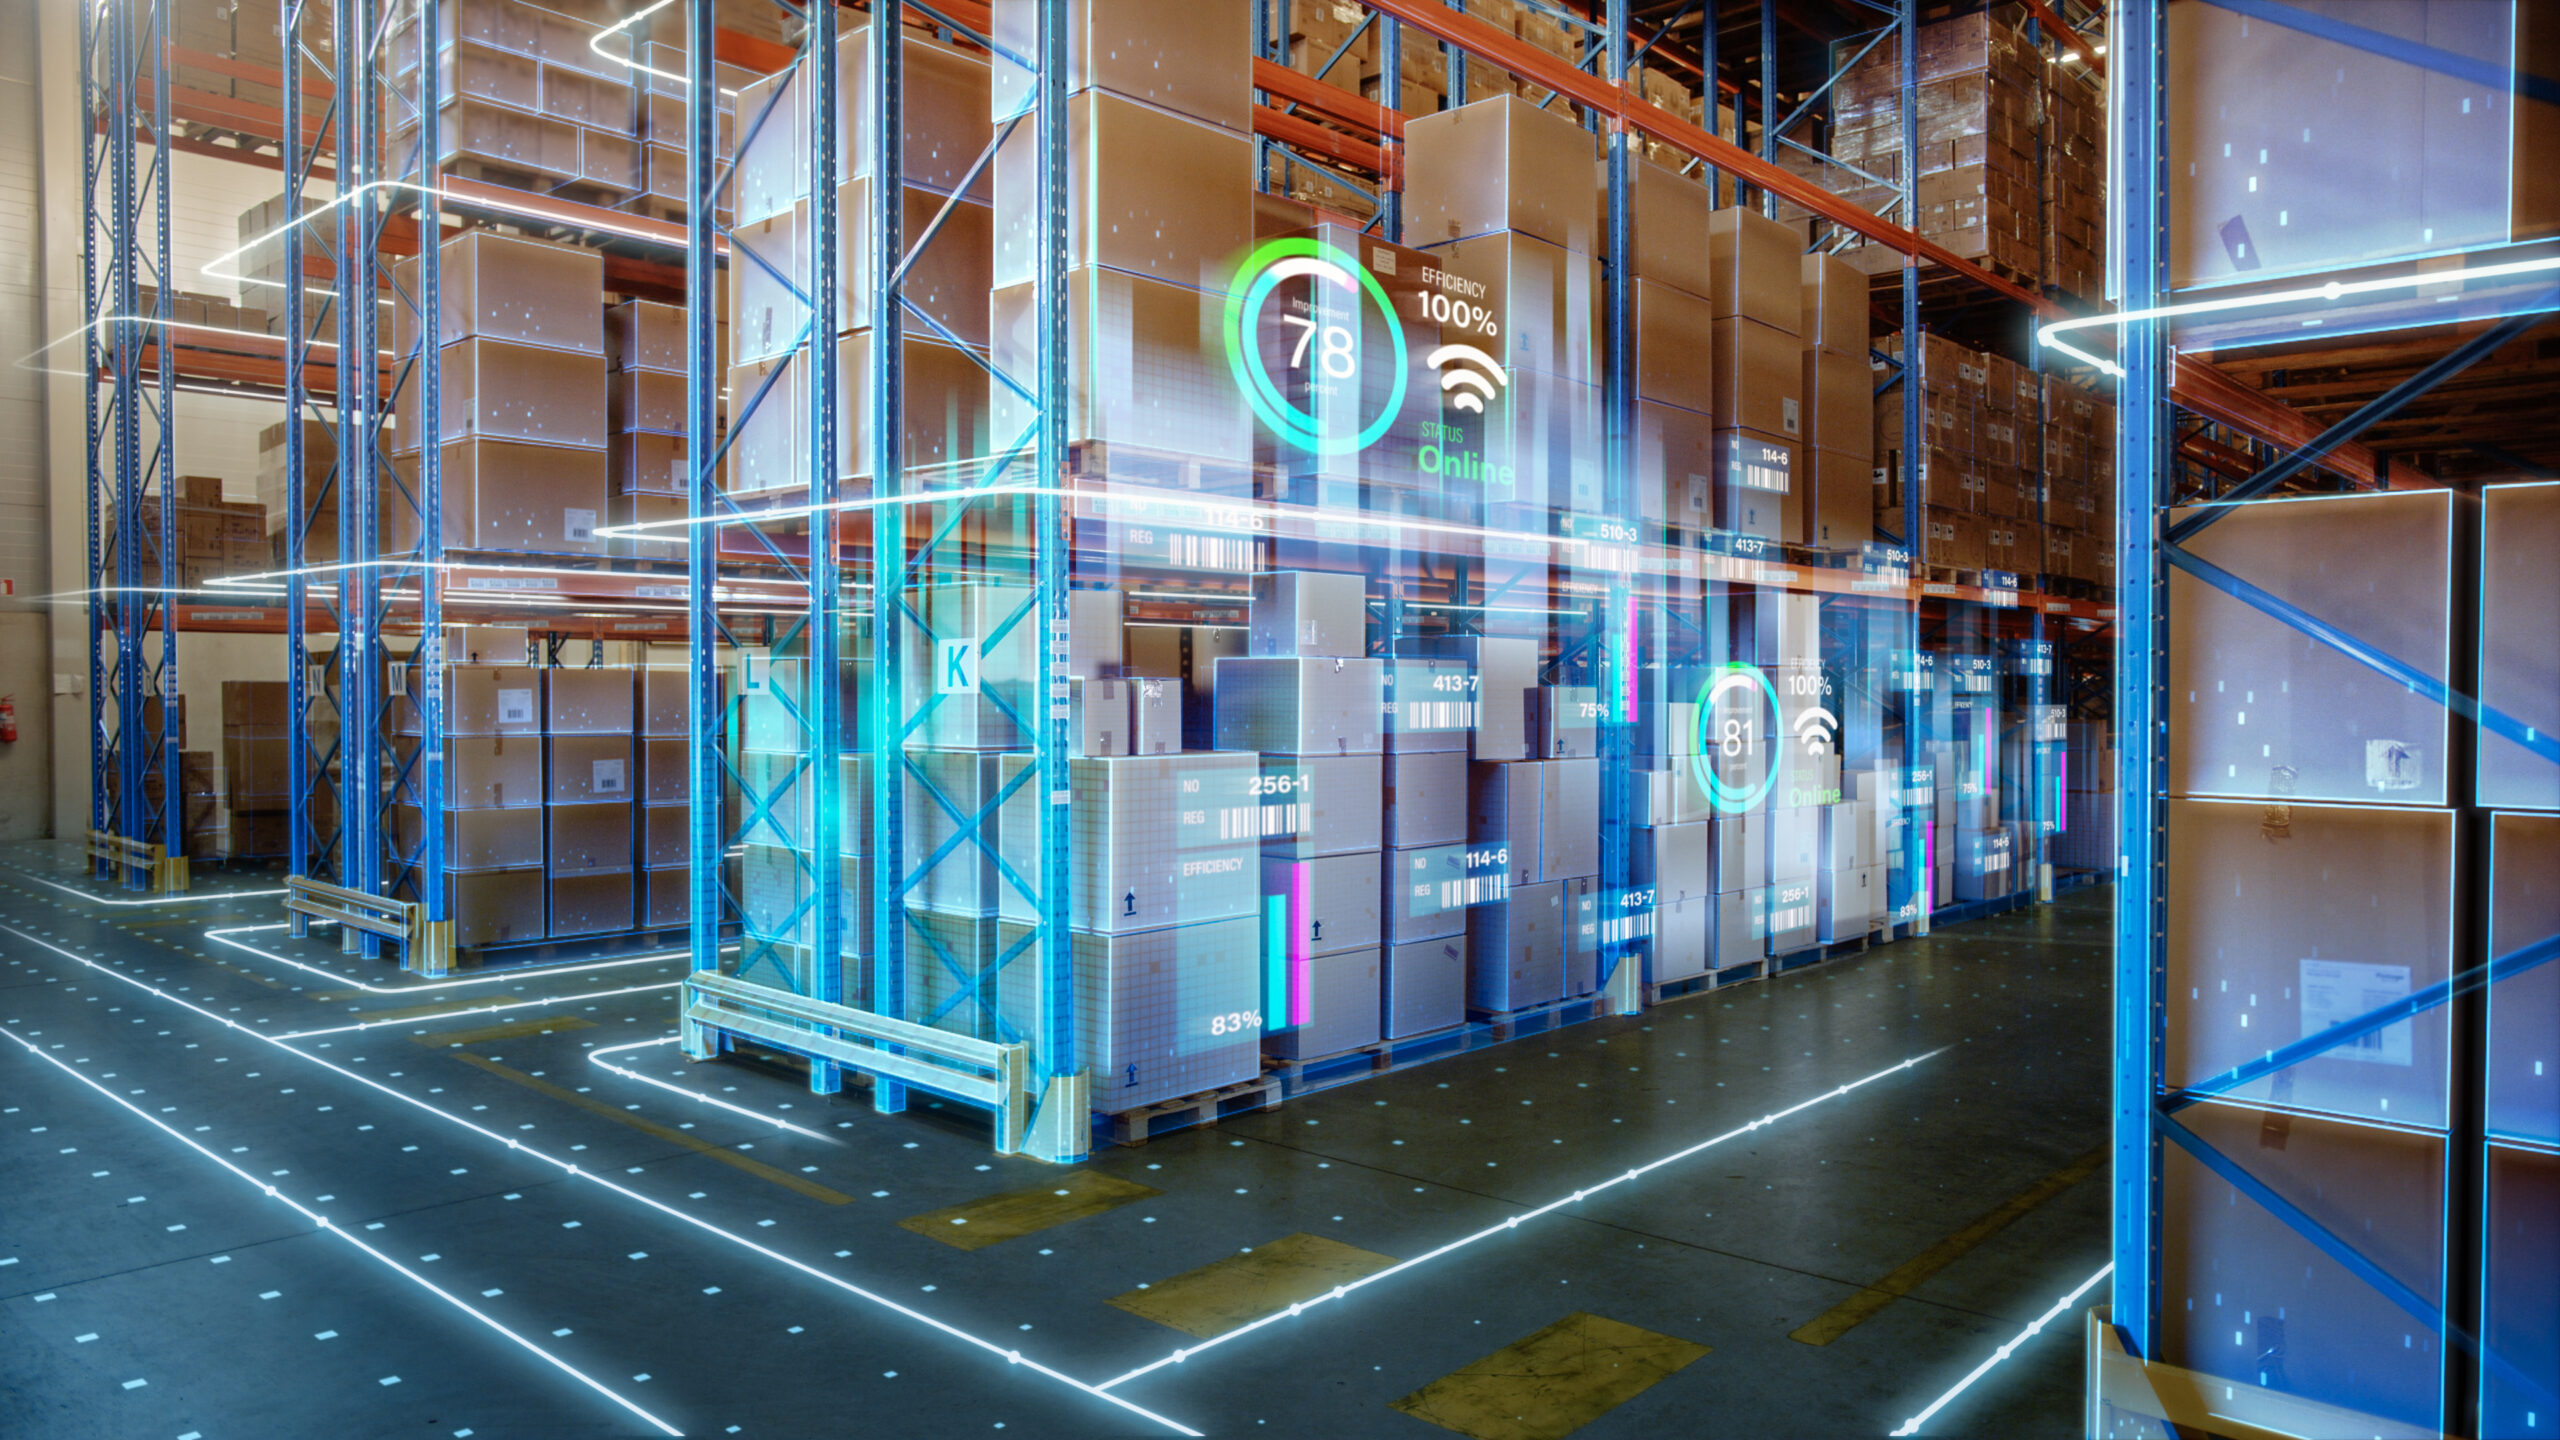
Discover our Digital Twin Simulation Software and create a virtual representation of complex infrastructures and processes to make data-driven decisions and optimize your business.
InControl – Digital Twin Simulation Software
InControl – DIGITAL TWIN SOFTWARE
Established in 1989, InControl Enterprise Dynamics is a global simulation software company offering Digital Twin software solutions for Material Handling and logistics, Manufacturing, Transportation, Leisure Venues, and Metropolitan Areas. We add value to your decision-making process, operational monitoring & control, and performance optimization. Our software solutions play a vital role during all project phases, from system design to implementation and operations.
Improve your business with InControl’s Digital Twin Software platform and expertise, enabling you to:
Improve Decision Processes
Transfer data into predictive and reliable analytics to understand complex infrastructures. Share results and insights with all stakeholders
Cope with challenges
Related to time, costs, resources, productivity, reliability, safety and sustainability.
Avoid risks
Simulation Software enables you to evaluate your potential and/or future resource investments.
Optimize business processes
Streamline and integrate processes contributing to one time right deployment reducing time, effort and costs.
Design, Built, Test & Maintenance
Gather, model, simulate, analyse data and present relevant information
Visualize
Provide relevant information, graphs, dashboards, insights and scenario’s.
try out our software!
Experience the power of our software with a 15-day free trial and explore firsthand how our Digital Twin Software can enhance your operations.
Start your free trial today and discover the difference.
Discover our Domains
Across various industries, businesses, organizations, universities, and research and development institutes rely on our software to gain valuable insights into their operations, make informed data-driven decisions, and enhance overall performance.
> Material Handling
& Logistics
> Transportation
> Manufacturing
> Metropolitan
Areas
> Leisure
Venues
Software implementations


Experience our software